[The route to the East Indies - three sea charts printed on vellum]
[1] Wassende graade Paskaart vertonende alle de Zeekusten van Europa [; 2] West-Indische Paskaert waer in de graden de breedde over weder zyden vande middllyn wassende soo vergrooten, dat die geproportioneert syn tegen humne nevenstaende graden der lengde [; 3] Oost Indien.
[1] T' Amsterdam by Pieter Goos op t'water inde Vergulde Zee Spiegel [; 2] Beschreven door A. Jacobsz [; 3] T' Amsterdam by Pieter Goos op het water inde Vergulde Zee Spiegel
c1646-1665.
A set of three engraved maps, each printed on a single, large, vellum skin with fine original hand-colour, each chart with remnant mount perforations at sheet edges.
Dimensions (to neatline):
1. Europa - 695 by 876mm 2. West Indische - 710 by 887mm 3. Oost Indien - 686 by 853mm
A previously unrecorded set of the first large-scale printed 'Paskaerts' to show the entirety of the route from Europe to the East Indies on Mercator's projection - an apparently unique survival as a set.
The set should be seen as both the acme of the navigational achievements of the Dutch Golden Age, and the pivot point signifying the Dutch East India Company's (Vereenigde Oostindische Compagnie - VOC) acceptance of the dispersal of their hitherto arcane information ...
A previously unrecorded set of the first large-scale printed 'Paskaerts' to show the entirety of the route from Europe to the East Indies on Mercator's projection - an apparently unique survival as a set.
The set should be seen as both the acme of the navigational achievements of the Dutch Golden Age, and the pivot point signifying the Dutch East India Company's (Vereenigde Oostindische Compagnie - VOC) acceptance of the dispersal of their hitherto arcane information into general commercial use.
The 'Oost Indien','West Indische', and 'Europa' plotting charts, on vellum, show, for the first time, the route to the East Indies in a uniform format, on Mercator's projection, and with the prime meridian located on Tenerife. The 'Oost Indien' chart is also the first printed map to name all the seventeenth century Dutch discoveries in Australia.
Produced at the height of the "Golden Age", these charts present a rationalisation of the geographic discoveries and advances in navigation and cartography made by the Dutch over the preceding 60 years: from the foundation of the VOC in 1602; via Hendrik Brouwer's 1611 route to Indonesia; the first landfall in Australia in 1616; the adoption of Mercator's projection for trans-oceanic voyages; consensus on a prime meridian; and Tasman's voyage of 1642-1644. Prior to their publication, much of this information would have been the secret preserve of the VOC's monopoly.
The Spice Trade
Nearly 2500 years ago, Arab traders told stories of the ferocious cinnamon bird, or cinnamologus. This weighty fowl made its nest from delicate cinnamon sticks, the traders said. One way to get the cinnamon was to bait the cinnamologus with large chunks of meat. The birds would fly down from their nests, snatch up the meat, and fly back. The precarious cinnamon nests would collapse when the bird returned laden with its catch. Then quick-witted traders could gather up the fallen cinnamon and take it to market. As enticing as the tale is, the fabled cinnamologus never existed. The story was most likely invented to ward off curious competitors from attempting to seek out the source of the spice. For many years, the ancient Greeks and Romans were fooled.
It might seem odd that something as seemingly inconsequential as a spice – a food flavouring or something to burn and perfume the air – would need such jealous guarding with elaborate tall tales. But the world's demand for spices grew throughout the Roman era and into the medieval period, defining economies from India to Europe. The result was a lasting change to people's diets in Europe, which, with the arguable exception of the United Kingdom, became a lot less bland and monotonous. More important, in Europe, spices became another way to define what it meant to be wealthy and powerful, which had a profound social, emotional and economic impact. As a result, the hunger for spices went well beyond their aromatic flavour; they became a new symbol of high social status.
The demand for spices gave rise to some of the first truly international trade routes and shaped the structure of the world economy in a way that can still be felt today.
The Route to the East Indies
For nearly one hundred years, after Vasco da Gama discovered a sea route to India in 1499, the Portuguese and the Spanish were dominant in the eastern and western hemispheres respectively. This dominance was aided by a policy of extreme cartographic secrecy by both crowns, and returning ships were required to surrender both their charts and information on any discoveries made: all charts were state property, and illegal use or copying was punishable by death. However, smuggling often took place, and piracy by both English and Dutch vessels meant that, eventually, the routes to both the "Old", or East, and "New", or West, Indies became available to northern Europe. Using this purloined information, the British East India Company (EIC) and Dutch Vereenigde Oostindische Compagnie (VOC) were established - in 1600 and 1602 respectively
- to cash in on the lucrative trade in nutmeg, pepper, cinnamon, cloves, and other spices. These monopolistic giants continued the tradition of jealously guarding the secret charts that laid the path to the source of their immense wealth and power. Both organisations employed teams of chartmakers or hydrographers to record the most up-to-date navigational information for speedy distribution in order to obtain commercial advantage with the quickest routes to the most profitable markets. The principal vector for this information was the 'Paskaert'.
Paskaerts
The large format long-range plotting charts of the journey (or passage, hence 'paskaerts'), were initially unique manuscript charts, amended and issued to their ships one at a time. However, as operations grew in size, printing became a convenience, either on paper or on vellum.
Vellum charts were often preferred as they were more durable than paper and had the advantage that they could be repeatedly re-used for laying down tracks for each voyage. Unlike paper, a vellum sea chart could be wiped clean of the plotted tracks of each voyage after its completion, insuring a clean template for the next expedition. Further, vellum charts were easily rolled and kept in a metal tube.
Paskaerts existed in a number of versions: the equal degree plane chart, the unequal degree plane chart, the spherical, and charts on Mercator-projection.
"Although already available after 1600, the Mercator charts with their 'waxing degrees of latitude' were little liked by sailors, who regarded them as 'difficult'. Nonetheless, they were superior to equi-rectangular (plane) charts and more suitable to ocean voyages" (Kok and Schilder, p.94).
The West Indische Paskaert
In c1630, Willem Blaeu, who was, himself, chief hydrographer to the VOC, published his 'West Indische Paskaert':
"Blaeu's West Indische Paskaert in Mercator-projection is a keystone in the cartography of the Atlantic ocean in the seventeenth century. In the title it says clearly that this chart was intended for navigating the areas of Africa and America where the Dutch West India Company's monopoly applied. The South American continent is completed all the way down to Cape Horn by means of an inset chart" (Kok and Schilder).
Campbell says that only "a few examples at most" of each state have survived. The title indicates that the Paskaert was designed to show the area chartered to the West India Company in 1621. Destombes and Gernez suggest that the lack of a privilege on the first state indicates that it was used exclusively by the company and not available to the general public. However, it would appear that the chart's existence was no secret and, at some point after 1630, it was revealed to the wider public. Blaeu's chart:
"[the] earliest printed chart of the Atlantic… became immediately the standard chart for navigation to America and the Cape of Good Hope" (Waters).
Destombes and Gernez further praise the 'West Indische Paskaert' as "an extremely interesting chart because it is one of the earliest engraved and printed to include latitude… this scientific and artistic document of the first order marks an important date in the history of nautical cartography and is one of the most important contributions that the Lowlands produced in the XVII century".
After Blaeu, no fewer than ten publishers brought out twenty one editions of the 'West Indische Paskaert', either by printing them from the same copper plate or from copies with the aid of new copper plates. Chief amongst these was Anthonie Jacobsz, author of the 'West Indische Paskaert' in the present set:
"… it appears that among Blaeu's followers, Anthonie Jacobsz. Should be especially mentioned. He was the only one who strived to improve this long range plotting chart, where possible, and the only one who produced original work" (Kok and Schilder).
Determination of longitude at sea was not possible without a considerable margin of error until the mid-eighteenth century. One of the methods that was used instead was dead reckoning, from the last point of land sighted. Jacobsz improved Blaeu's original by shifting the whole map eastwards one degree within the Canary Islands to move the location of the prime meridian from Ferro to the sailor's preferred landmark of the 3,718 metre peak of Pico de Teide on Tenerife, in order to facilitate dead reckoning. He also included an inset of Scotland and Ireland to assist with the northern navigation.
The final reveal – the Oost Indien Paskaert
Despite the success of Blaeu's chart and its successors, the VOC would keep the final piece of the puzzle – the navigation of the Indian Ocean and the all-important route to the East Indies – hidden from general release until sometime later.
It was not, in fact, until c1658, that Pieter Goos, a private Amsterdam publisher, decided that the information initially restricted to VOC use only had entered the public realm to a sufficient degree that he felt emboldened to offer a printed chart of the Indian Ocean for general release. Goos' 'Oost Indien' chart shows the VOC shipping lane outbound from Cape of Good Hope to Sunda Straits, and, for the first time, names all the Dutch discoveries in Australia, from the first landfall in 1616, to Abel Tasman's voyage of 1642-1644.
This chart, on its own, however, did not detail the entirety of the route to the East Indies. In order to complete the navigation, two further charts would be required – the aforementioned West Indische Paskaert, and, for the beginning of the voyage, a European chart to assist with the tricky navigation from the Dutch ports and out into the Atlantic.
A set of connected charts
The potential demand for a uniform series of charts detailing the route to the East Indies was not missed by Pieter Goos and, in c1658, his intention to publish a chart of Europe on Mercator's projection is recorded in a notorial agreement dated 17 July 1658. In this agreement, the publisher Gerrit van Ghoesbergen states his intention to produce a manuscript chart by Dirck Rembrantsz [van Nierop] with Pieter Goos. Having published both an East Indian Paskaert, and a European Paskaert, one might suspect that Pieter Goos would embark upon his own 'West Indische Paskaert' on Mercator's projection.
The survival of the present set of three charts, combined with a careful examination of both the format and composition of the charts suggests an alternative: Goos produced both his 'Oost Indien' and 'Europa' charts following on from, and as companions to, Anthonie Jacobsz' version of the 'West Indische Pascaert'. The evidence for this is fivefold: all three charts are landscape in format; all three charts are on Mercator's projection; all three charts are printed from a single, large, copper plate of similar dimensions; all three charts take Tenerife, not Ferro as their prime meridian; and all three charts overlap geographically and allow navigation from one to the other.
Indeed, of the twenty one editions that follow Blaeu's 'West Indische Paskaert', all bar Jacobsz's chart are between 755 and 780mm tall, whereas Jacobsz's chart is noticeably shorter at 700mm. The range of European Pascaerts by all other publishers, according to the dimensions given by Kok and Schilder, is between 605 and 710mm tall. Goos's comparable chart on Mercator's projection is here at the larger end of that range at 695mm, bringing it neatly into line with both Goos's 'Oost Indien' at 710 by 870mm, and the 'West Indische Pascaert' at 700 by 880mm. These slightly tighter dimensions permitted the mapmaker to use slighter smaller skins, making sourcing of materials easier and cheaper, whilst, at the same time, retaining sufficient scale to plot a course.
The idea for a uniform sequence of charts may well, of course, have been that of Anthonie Jacobsz himself, as he published two different 'West Indische Paskaerts'; one in c1646, and a second – the present example – in c1650. The main differences between the two being a shift in the prime meridian, the inclusion of an inset of Scotland to facilitate navigation in the north, and a format that more closely matches that required for charts of Europe and the Indian Ocean. Jacobsz, however, died in 1650, and no record has, thus far, been discovered of his intention to publish the additional charts.
Further, evidence that Goos issued the three charts as a set is provided by an advertorial included in Johannes van Keulen's 'De Groote Nieuwe Vermeerdere Zee-Atlas ofte Water-Werelt' of 1688 that tells of four vellum charts that are now available from him and that these charts are printed from plates formerly in the possession of Goos.
The survival of the present set suggests that Pieter Goos made the set available at some point after the publication of the first state of the 'Oost Indien' chart in 1658, and definitely by 1665 (the date of the 'Oost Indien' chart in the present set). Therefore, about sixty years after the foundation of the VOC, a uniform set of connected plotting charts on Mercator's projection was finally available for purchase by boats heading East.
Description of the Individual Charts
The Chart of Europe
The chart of Europe is separated in two parts at 61º North by a double longitude scale. The northern part is displaced relative to the southern part by c39º counting in the east. The main chart covers the area to the west of Ireland, still showing the Azores whilst Cyprus in the east is shown at the easternmost limit, retaining part of the Black Sea. In the north-south direction the main chart runs from southern Sweden down to the north coast of Africa. The secondary chart in the north is compressed by a factor of about three in order to ensure transfer of navigation to the 'West-Indische Paskaert'. This has the convenient side-effect of making both parts of the map similar in dimension, and so permits both to be displayed on a single piece of vellum. This section covers the area from Buttons Bay in the west to just part Nova Zemlya in the east. The secondary chart is limited to the north by a line north of Spitzbergen, passing through mid-Greenland to the West.
The chart may be dated from the notarial agreement between Gerrit van Ghoesbergen, Dirck Rembrantsz van Nierop, and Pieter Goos mentioned above. This agreement lays down a minimum price (2½ Guilders) for the product.
A later state of the chart, published by Van Keulen, played a role in the quest for longitude. In 1687 the horologist Christiaan Huygens (1629-1695) was commissioned by the VOC to supervise an experiment with two of his pendulum clocks for the purpose of determining the correct longitude at sea. The ship 'Alckmaar' was dispatched to the Cape of Good Hope; on the outbound voyage the experiment failed because of mechanical problems with the clocks and because Thomas Helder, one of the pilots in the project died. Huygens used a then common chart for the southern part, but for the area north of 27º he relied on the present chart. According to Huygens's report to the VOC, the experiment was successful in principle. The official report is on file in the National Archives in The Hague.
Orientated with West to the top. The primary compass rose is located over the Öresund. Baffin Island is shown with a hypothetical northwestern coastline, as applies to the mainland coast opposite. The western part of Hudson Bay is labelled 'Buttons Bay'. Novaya Zemlya is shown.
Two large decorations are provided west of the Black Sea and in Greenland; the latter depicts a polar bear hunt, the former consists of an allegorical image figuring 'Europe' on a bull and a party of seventeenth century persons, using various tools, including a cross staff.
Latitude scale on the southern part 30 degrees N - 61º20' N, sub-divided per full degree and per two German miles. Longitude scale on the southern part: 000-057º 40' minutes East.
The Chart of the Atlantic
A scale of 0-150 German miles appears just south of the equator at 353 degrees east.
A double latitude scale split at the equator, located in mid-ocean with German miles from the equator posted along the scale: 53º20'N- 37º10'S, sub-divided per degree, for 20º and two German miles. The dual longitude scale is provided along the equator from 270ºE to 040º30'E, sub-divided per degree and in 20'. The prime meridian runs over Tenerife. With two inset maps; one in South America, showing the continuation of the continent down to Cape Horn. The other in the upper right, depicting northern England and Scotland on a scale different from that of the main chart.
The South American inset has a dedicated latitude scale, centrally through South America, showing the continuation of the main scale down to 58º40'S, again in German miles along the scale. A longitude scale is not provided for this inset. The inset is ornamented at the lower left with a Patagonian family group, and its cartouche is flanked by a Native American with a shield and spear on the left, and an African figure bearing a bow and arrow on the right.
The Scottish inset has a dedicated latitude scale from 53ºN to 62º40'N, and a dedicated longitude scale ranging from 0º-022E.
In several countries coats of arms are displayed, including those of France, the Dutch Republic, England, and Spain on the north eastern seaboard of north America. Other decoration includes various ships, a sea monster at lower left and various animals dotted around the interior of Africa.
The cartouche is decorated with the Lootsman family emblem – a sailor holding a lead and line, and the official coat of arms of the Dutch West India Company.
The present chart is Jacobsz's second 'West Indische Paskaert', and represents a considerable improvement on both Blaeu's original, and Jacobsz's first attempt.
The required change in longitude provided the opportunity for a number of corrections. An inset was added to provide the capability for sailing north around Scotland, facilitating better use of prevailing winds and catering for problems of politics and piracy brought on by sailing too close to English harbours.
The Chart of the Indian Ocean
The chart shows a practically complete outline for Australia, except for the East and Southeast coasts.
Latitude scale in mid-ocean just east of Ceylon from 45ºN to 35ºS, subdivided in full degrees and 20'. The equivalent number of German miles from the equator is posted on its left. The latitude scale is continued at the very left in full degrees without German miles down to 46º20'S. A dial longitude scale is provided along the equator from 37º20'E to 166º20E, sub-divided in full degrees and in 20'.
Careful comparison with the 'West Indische Paskaert' shows that the prime meridian runs through Tenerife. This detail seems to have been overlooked by previous bibliographers, who suggest that the prime meridian runs through Ferro, although Kok and Schilder are aware of some inaccuracy in this and state (incorrectly) that "[t]he prime meridian runs over Ferro in the Canary Islands, within the tolerance of longitudinal presentation".
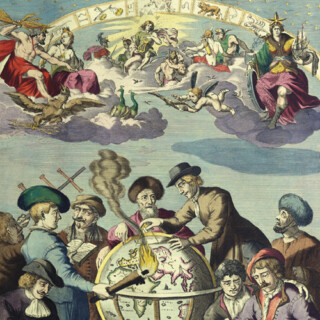
The chart is decorated with two large scenes at the top and the bottom, whilst a smaller one is situation at the left just above the equator. The interaction between the Europeans and Asian people is depicted with reference to trade in general.
New Holland: the Dutch Discoveries
In 1602 the States General granted the newly-formed United East India Company (VOC) a monopoly of Dutch navigation in the vast area east of the Cape of Good Hope, and to the west of Estrecho de Magallanes: the combination of the Pacific and Indian Oceans. The Company immediately centred its operations on the Malay archipelago, and in a remarkably short time established a trading empire that extended from Southern Africa to East Asia. Voyages of exploration to seek out new commercial opportunities were an integral part of the Company's activity, with the direction of voyages often determined by reports heard in the East, of countries and islands that offered great riches.
This desire to open new trade led the merchants to undertake a number of voyages to the south land shortly to be named 'Nova Hollandia', but not all Dutch discoveries of its coasts reflect this conscious purpose. Much of the knowledge of its western and southern regions came from accidental discovery made as a consequence of masters following the VOCs instruction in 1616, that they use the 'Brouwer route' and sail one thousand German miles directly east after passing the Cape of Good Hope before turning north for Bantam, via the Sunda Straits. Given the prevailing difficulties in measuring longitude accurately, and, therefore, knowing the exact distance covered, this injunction led to a series of unintended sightings which played a part in the "unveiling" of the southern continent.
The chart reflects the results of Dutch explorations in the 1640s, including those of François Jacobsz, Visscher, Abel Tasman, and Maerten Gerritsz. Vries. These comprise the improved depiction of the Gulf of Tonking, the additions in the area around Japan, and the results of the discoveries as manifest as the south coast of Australia, and those present at Australia's north coast, in particular on the shores of the Gulf of Carpentaria. Just clear of the decorative cartouche, the islands of Amsterdam and St Paul may be seen, delineating the VOC shipping lane outbound from Cape of Good Hope to Sunda Straits.
This, second, state of the chart includes the islands of Dina and Marseveen. These islands were discovered by the VOC ship Maarsseveen under the command of Barend Barendsz Lam during the spring of 1663. The islands are situated southeast of Cape of Good Hope and are currently named Marion Island and Prince Edward Island.
The Mapmakers
Anthonie Jacobsz (c1606-1650)
Theunis or Anthonie Jacobsz was the founder of a flourishing printing and publishing house in Amsterdam. As there was more than one printer of the same name, he added the adjective "Lootsman" [pilot] to his, and his sons took this as their surname.
Pieter Goos (1616-1675)
Son of the engraver, Abraham Goos (1590-1643). "He was one of the best known maritime booksellers of Amsterdam… [In] the imprint of his works, Pieter Goos is always mentioned as a bookseller, never as a bookprinter… The well-made pilot guides and the beautiful sea-atlas reflect a high professional standard. The many editions published over 25 years is an indication of the customers' appreciation" (van der Krogt).
He bought the copperplates of the famous guide book for sailors, 'De Lichtende Columne ofte Zeespiegel' (Amsterdam 1644, 1649, 1650), from Anthonie Jacobsz.
There is some further evidence that the Jacobsz (Lootsman) and Goos family firms, despite being apparent competitors, cooperated on several occasions: the charts in a 1688 English edition of the Lootsman's 'Sea-Mirrour' in the Maritime Museum, Rotterdam are all by Goos, and a notary act of 1680 survives signed by Caspar Lootsman and Hendrick Goos – Anthonie and Pieter's sons – stating that they had made "since many years, a sea book of the Eastern, Western and Mediterranean Navigation called 'Stiermans Zeespiegel', 'Lootsman's Zeespiegel', and 'Nieuwe Groote Zeespiegel' respectively" (Koeman 223).
Goos published his own editions of this work in various languages, while adding his own maps. In 1666, he published his 'De Zee-Atlas ofte Water-Weereld', which is considered one of the best sea atlases of its time. Goos's sea charts came to dominate the Dutch market until the 1680s.
Rarity
We have been unable to trace any other set of the three charts, and the present examples have not been recorded previously. It appears that, until now, no bibliographer has made the connection between the shared format and prime meridian of the three charts, and the prospect that they were offered as a set. This prospect is re-enforced by the fact that there exists an advertisement for them (albeit in later states) in Johannes van Keulen's 'De Groote Nieuwe Vermeerdere Zee-Atlas ofte Water-Werelt':
"An advertorial included in Johannes van Keulen's 'De Groote Nieuwe Vermeerdere Zee-Atlas ofte Water-Werelt' of 1688 reports that four vellum charts [the present three charts, and his plane chart of Europe] are now available from him and that these charts are printed from plates formerly in the possession of Goos. Both the European plane and Mercator charts are mentioned expressis verbis to be amongst these four: '… als mede Europa Plat en Europa Wassende graden, door Dirk Rembrandtsz. Van Nierop'. This statement is repeated in the impressum cartouche centrally at the lower edge: 'Seyn nu te Bekoomen by Johannes van Kuelen [!]…; the spelling errors are remarkable" (Kok and Schilder, p749).
Known individual examples of the three constituent charts are as follows: Chart of Europe
In their 2019 census of charts printed on vellum, Schilder & Kok identify
only two examples of the present chart:
1. One on vellum in Amsterdam Universiteitsbibliotheek (OTM:HB- KZL L.K. VI4)
2. An uncoloured example printed on paper in Paris, Bibliothèque nationale de France (Ge DD 2987 B(181))
Chart of the Atlantic
Schilder & Kok identify four examples of Jacobsz' second West Indische Paskaert chart:
1. Amsterdam Het Scheepvaartmuseum (S2680)
2. Den Haag, Nationaal Archief (4.AANW 00030)
3. Rotterdam, Maritiem Museum (N358)
4. New York, New York Historical Society (L4.4.14)
Chart of the Indian Ocean
Schilder & Kok's survey reveals seven recorded examples of Goos' chart: three in the first state:
1. Amsterdam Universiteitsbibliotheek (OTM: HB-KZL L.K.VI.4)
2. Paris, Bibliothèque nationale de France (Ge 2987 [9670 B]), uncoloured and printed on paper
3. Sydney, State Library of New South Wales (Dixson Library Cc 67/1) And four examples of the second state, like the present example:
4. Greenwich, National Maritime Museum (250:1/2)
5. Paris, Bibliothèque de l'Institute de France (Ms 1288, nr 6)
6. London, Sotheby's, Travel, Atlases, Maps, & Natural History, 2010, lot 67 (missing about 25% at top, sold for £205,250)
7. American Private Collection (Richard B. Arkway Inc. New York, Catalog 62 [2005], nr 1 – very damaged)
bibliography:
bibliography:
Destombes, Marcel and Gernez Désiré, 'La West Indische Paskaert de Willem Jansz Bleau' in 'Un atlas nautique du XVI° siècle à la Bibliothèque royale de La Haye (Pays-Bas)', Lisbon, 1961.
Jonkers, A.R.T., 'Parallel meridians: Diffusion and change in early modern oceanic reckoning, in Noord-Zuid in Oostindisch perspectief', The Hague, 2005.
Schilder, Günter and Kok, Hans, 'Sailing across the World's Oceans – History & Catalogue of Dutch Charts Printed on Vellum 1580-1725', Koninklijke Brill NV, Leiden, 2019.
![GOOS, Pieter [and] JACOBSZ, A[nthonie]. [The route to the East Indies - three sea charts printed on vellum]](https://i0.wp.com/crouchrarebooks.com/wp-content/uploads/2025/03/16415_1H.jpg?fit=3500%2C2744&ssl=1)
![GOOS, Pieter [and] JACOBSZ, A[nthonie]. [The route to the East Indies - three sea charts printed on vellum]](https://i0.wp.com/crouchrarebooks.com/wp-content/uploads/2025/03/16415_3H.jpg?fit=3500%2C2734&ssl=1)
![GOOS, Pieter [and] JACOBSZ, A[nthonie]. [The route to the East Indies - three sea charts printed on vellum]](https://i0.wp.com/crouchrarebooks.com/wp-content/uploads/2025/03/16415_5H.jpg?fit=3500%2C2734&ssl=1)