PICQUET, Charles and CHATEÂUNEUF, Louis-François Benoiston de
Paris,
Imprimerie Royale,
1834
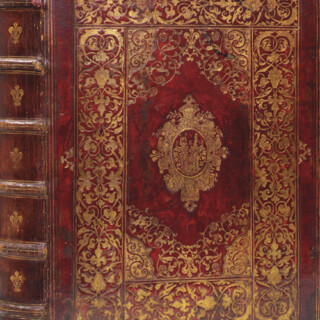
Marbled covers, brown leather spine in six segments separated by raised bands, title in gilt, marbled endpapers and pastedowns, five ribbon markers in green, red and black, 51 maps, seven folding.
This report on the 1832 cholera outbreak in Paris contains the first documented geospatial information system: a map of Paris by Charles Picquet (1771-1827), in which the city is divided into 48 districts represented by colour gradient according to the percentage of deaths from cholera per 1000 inhabitants in each. This groundbreaking piece of cartography would not only change the way statistics were used and alter the urban landscape of Paris, but also contribute to the di...
This report on the 1832 cholera outbreak in Paris contains the first documented geospatial information system: a map of Paris by Charles Picquet (1771-1827), in which the city is divided into 48 districts represented by colour gradient according to the percentage of deaths from cholera per 1000 inhabitants in each. This groundbreaking piece of cartography would not only change the way statistics were used and alter the urban landscape of Paris, but also contribute to the discovery of the cause of cholera.
The map and the report were an attempt by the French government to understand the spread and cause of the cholera epidemic which ravaged Europe in the 1830s. In total, 100,000 people died across France, and 20,000 of those in Paris. Heinrich Heine famously recorded a society masked ball where one of the harlequins stopped dancing and pulled off his mask to reveal a blue face (an early symptom), and cartloads of the guests were buried still in their costumes. The epidemic was hard to control because cholera baffled contemporary doctors, most of whom believed that it was a disease spread by unhealthy 'miasmas'. Symptoms could appear gradually or in just a few hours; on one side of a street every house might be affected while the other side remained unharmed.
The report was written by a special commission appointed by the Ministry of Commerce and Public Works, headed by Louis-François Benoiston de Châteauneuf. Picquet, who was a state cartographer under both Napoleon and the reinstated Bourbon monarchy, provided the maps. The report gives details of the epidemic, the methods used to keep records and to compile the report. After there is a section dividing the city into 48 quartiers, and systematically listing each arondissement and the quartiers within it, providing a map each time. For each quartier there is a page of tables giving details on the area it covers, the population, and the cases of and deaths from cholera. The report concludes with the famous gradient map, showing the death rate for each quartier, a relief map of the city, and a tabular map showing the mortality rate for each commune in the Seine departement. The report shows that in most cases mortality rates were much higher in poor, overcrowded areas, but takes care to distinguish between high population density and overcrowding. It concludes that population density was not an explanation for high mortality rates unless it was accompanied by poverty, concluding that climatic factors could not explain why infection rates differed so much from one area to another, which undermined the miasmic theory.
The report was an important step towards the eventual understanding of the transmission of cholera by waterborne microbes, which John Snow arrived at in London in 1855 after his analysis of cholera cases near the Broad Street pump. It also affected the urban landscape of Paris: it highlighted the need for redevelopment of housing in poorer areas and eventually the removal of the central open sewers which flowed through most of Paris' streets, culminating in the hygienist policies of Baron Hausmann. And finally, the thoughtful analysis of the records marked an important turning point in the application of statistics to socio-economic issues.
We have only been able to trace one example of this work appearing at auction; although there are several institutional copies, it rarely appears on the market.